What is moving now, and how does this hour usually behave?
Before you trade: see what is open, what is moving, which way this hour usually closed and how far it usually travels. Statistics from live prices, in your own time zone.
Is the market open, and when is the busy part?
Forex runs in sessions that overlap. The most movement usually comes when London and New York are open together. The strip at the top already shows what is open in your time zone.
- which sessions are open and the busiest overlap, in your time
- the symbols that are open right now
- a countdown to the next open or close
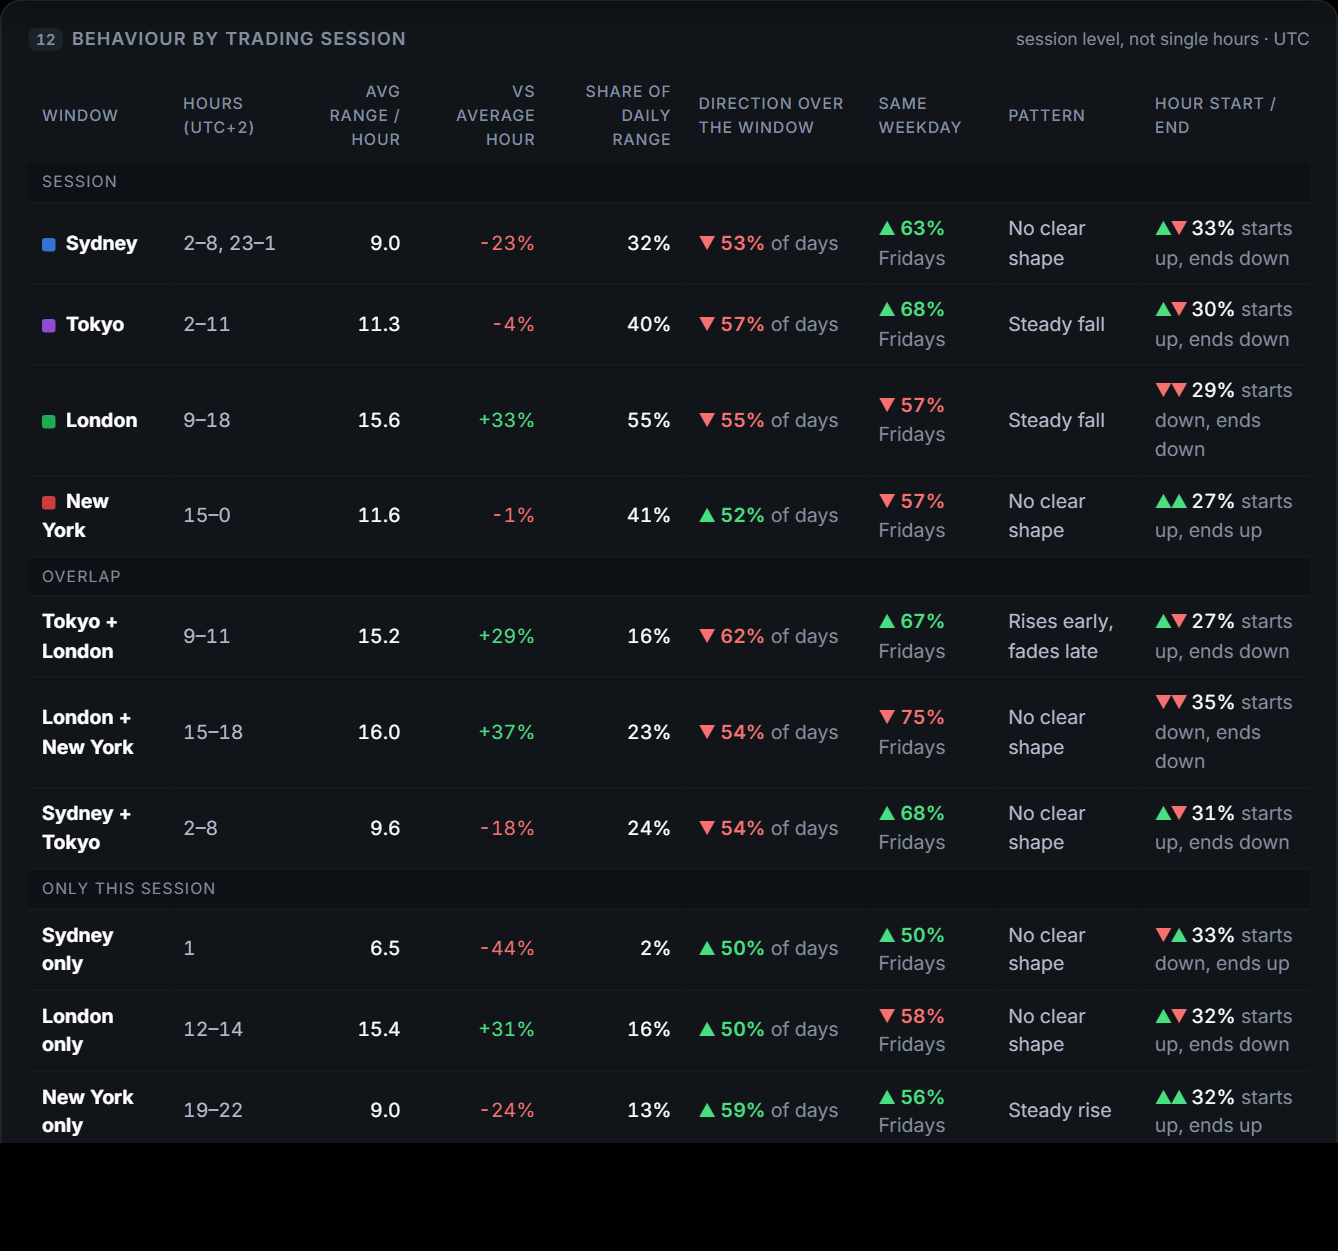
What is moving right now?
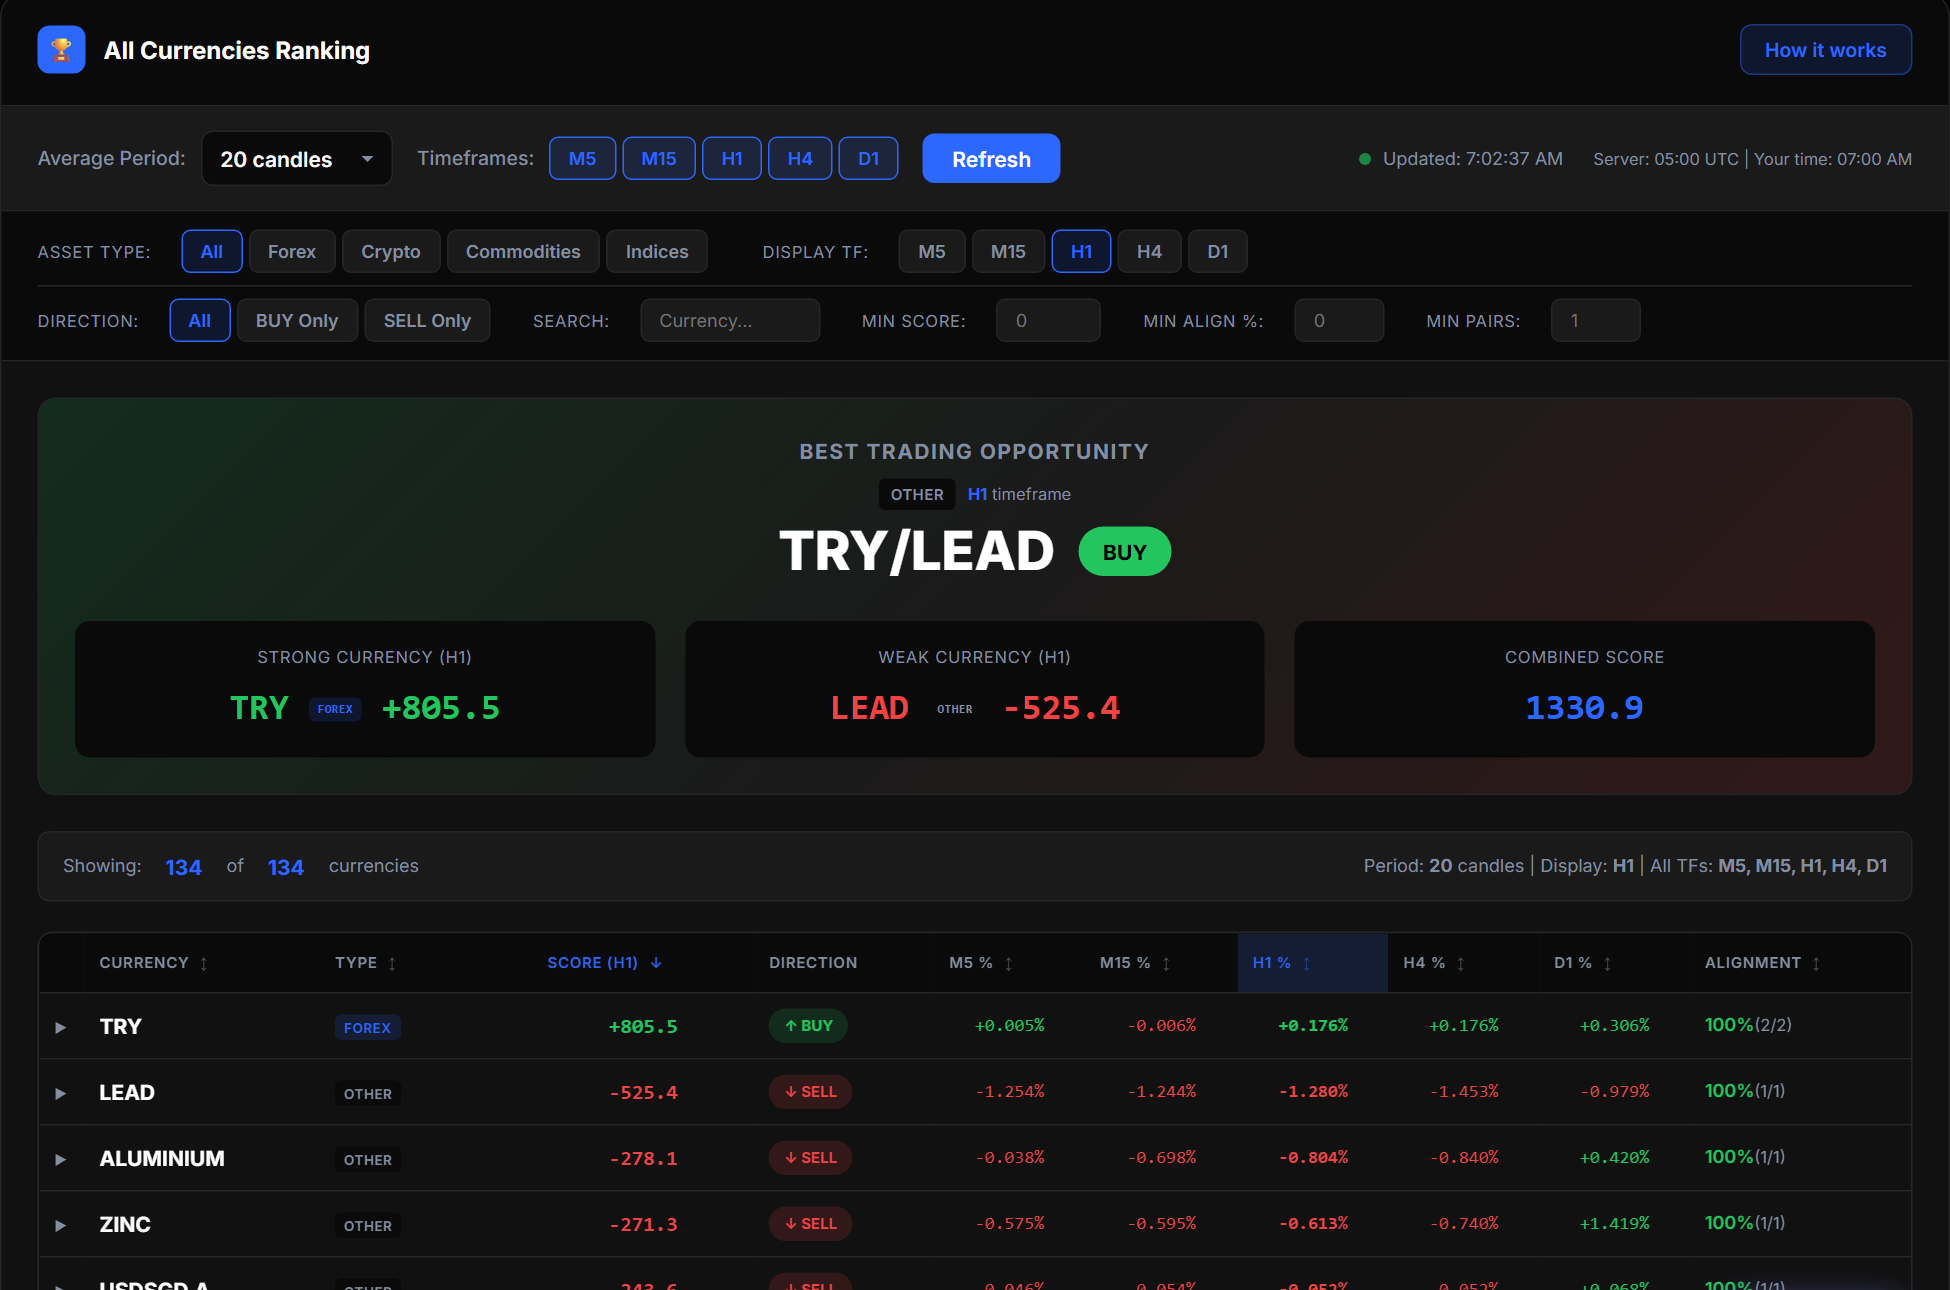
Look through every symbol at once instead of opening charts one by one, or see which currencies are strongest and weakest.
- every symbol with Busy, Normal or Quiet for this hour
- the strongest and weakest currencies
- pick one currency to see all its pairs
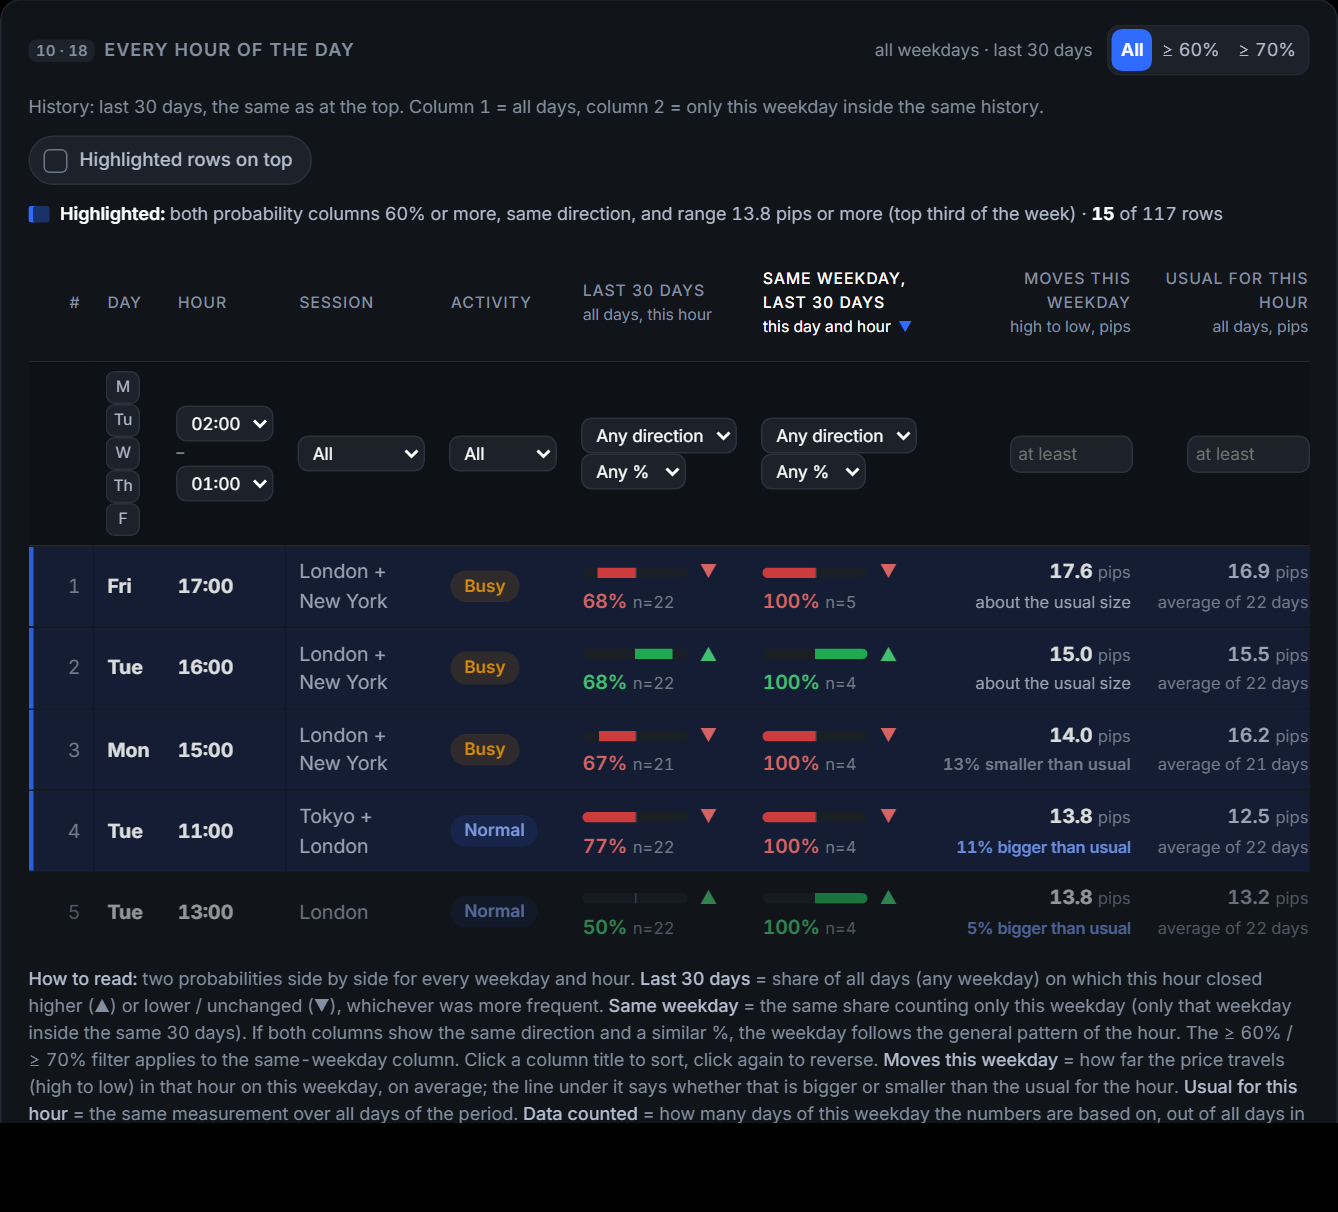
Which way did this hour usually close?
For one symbol: on how many of the last days did this hour close higher or lower. Every percentage shows the days behind it.
- for every symbol, higher or lower at this hour with the days counted
- sort by the clearest pattern
- filter by forex, metals, indices or crypto
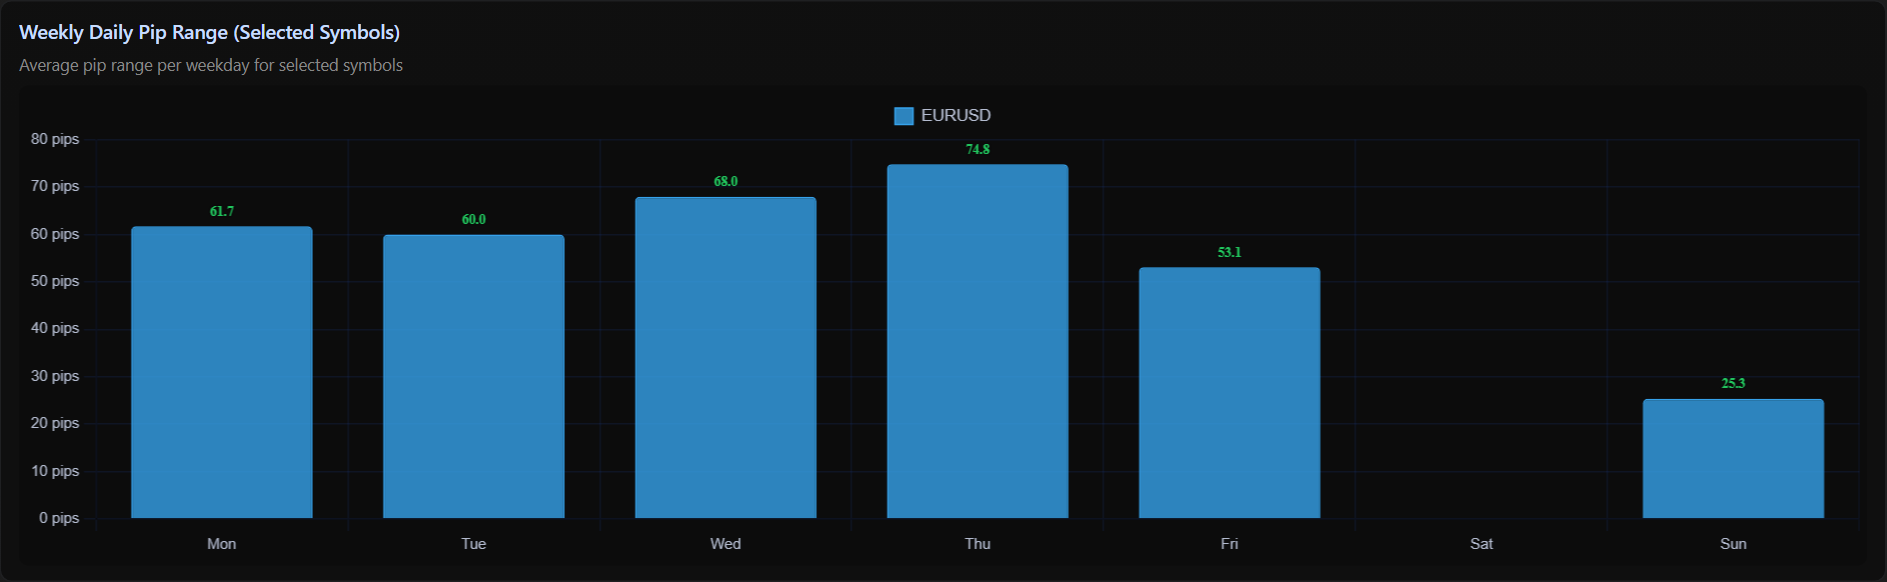
How many pips does it usually move?
Know the normal range per weekday and per hour, so your target and stop are based on what the symbol really does.
- the usual daily range of every symbol
- range now compared with usual
- sort by the biggest and the quietest movers
Everything you need to prepare, nothing you have to believe
Live data
Prices from a live feed, candles built on the hour, shown in your time zone.
Hourly history
7 to 60 days of hourly and weekday patterns for forex, metals, indices and crypto.
Honest statistics
Every number shows the days behind it. Past patterns do not predict future moves, and we say so where the numbers are.
Get the hours that matter, by email and in your account
A free account unlocks the full data in the dashboard, the weekday table, 14 and 30 days of history and your favorite symbols.
Historical statistics for information only. Not investment advice and not a recommendation to buy or sell. Past patterns do not predict future moves. Trading leveraged products carries a high risk of loss.